Metis Project-02
Wow, I'm embarrassed to say it's been such a long time since I last posted on this blog. I've been heavily focused on my Metis projects that my idea of regularly updating my progress in sync with the Metis timeline went completely out the window! I am now in my last week at Metis. Time has just gone by so quickly!! Now that I had just turned in my final project in today, I finally have some time to sit down and write about the projects I've done.
The topic for this project is on regression. I decided to create a model to predict a country's Social Progress Index. We learned about linear regression, polynomial regression, as well as regularization methods and linear assumptions. For this project we were required to scrape our own data using BeautifulSoup and Selenium. Some other topics we touched upon were some light feature engineering and data leakage.
Social Progress Index
For a very long time, Gross Domestic Product (GDP) has been the prime indicator used by economists as a measure of the growth and success of a country.
Gross domestic product (GDP) is the total monetary or market value of all the finished goods and services produced within a country's borders in a specific time period. As a broad measure of overall domestic production, it functions as a comprehensive scorecard of a given country’s economic health. -Investopedia
The major criticisms of GDP is that it only looks at monetary output of a country and it does not necessarily consider the general well-being of citizens. Even with an increasing GDP, a country may be exhibiting increasing wealth inequality. Another example of the drawback of GDP is the cost of cleaning up pollution. By using processes that create pollution, the amount of money generated to clean up the pollution adds to the GDP, however having this pollution generation does not benefit social and environmental well being at all.
New Zealand has already been looking for different metrics to use to supplement GDP to account for these drawbacks. They have been experimenting with using the Genuine Progress Indicator (GPI) to replace GDP.
[GPI] is essentially a macro-scale analysis of the costs and benefits of activities associated with economic activity. It includes personal consumption of goods and services as one of the largest benefits, but it balances this with costs, which may include social factors such as income inequality and environmental factors such as water pollution and the emission of greenhouse gases.
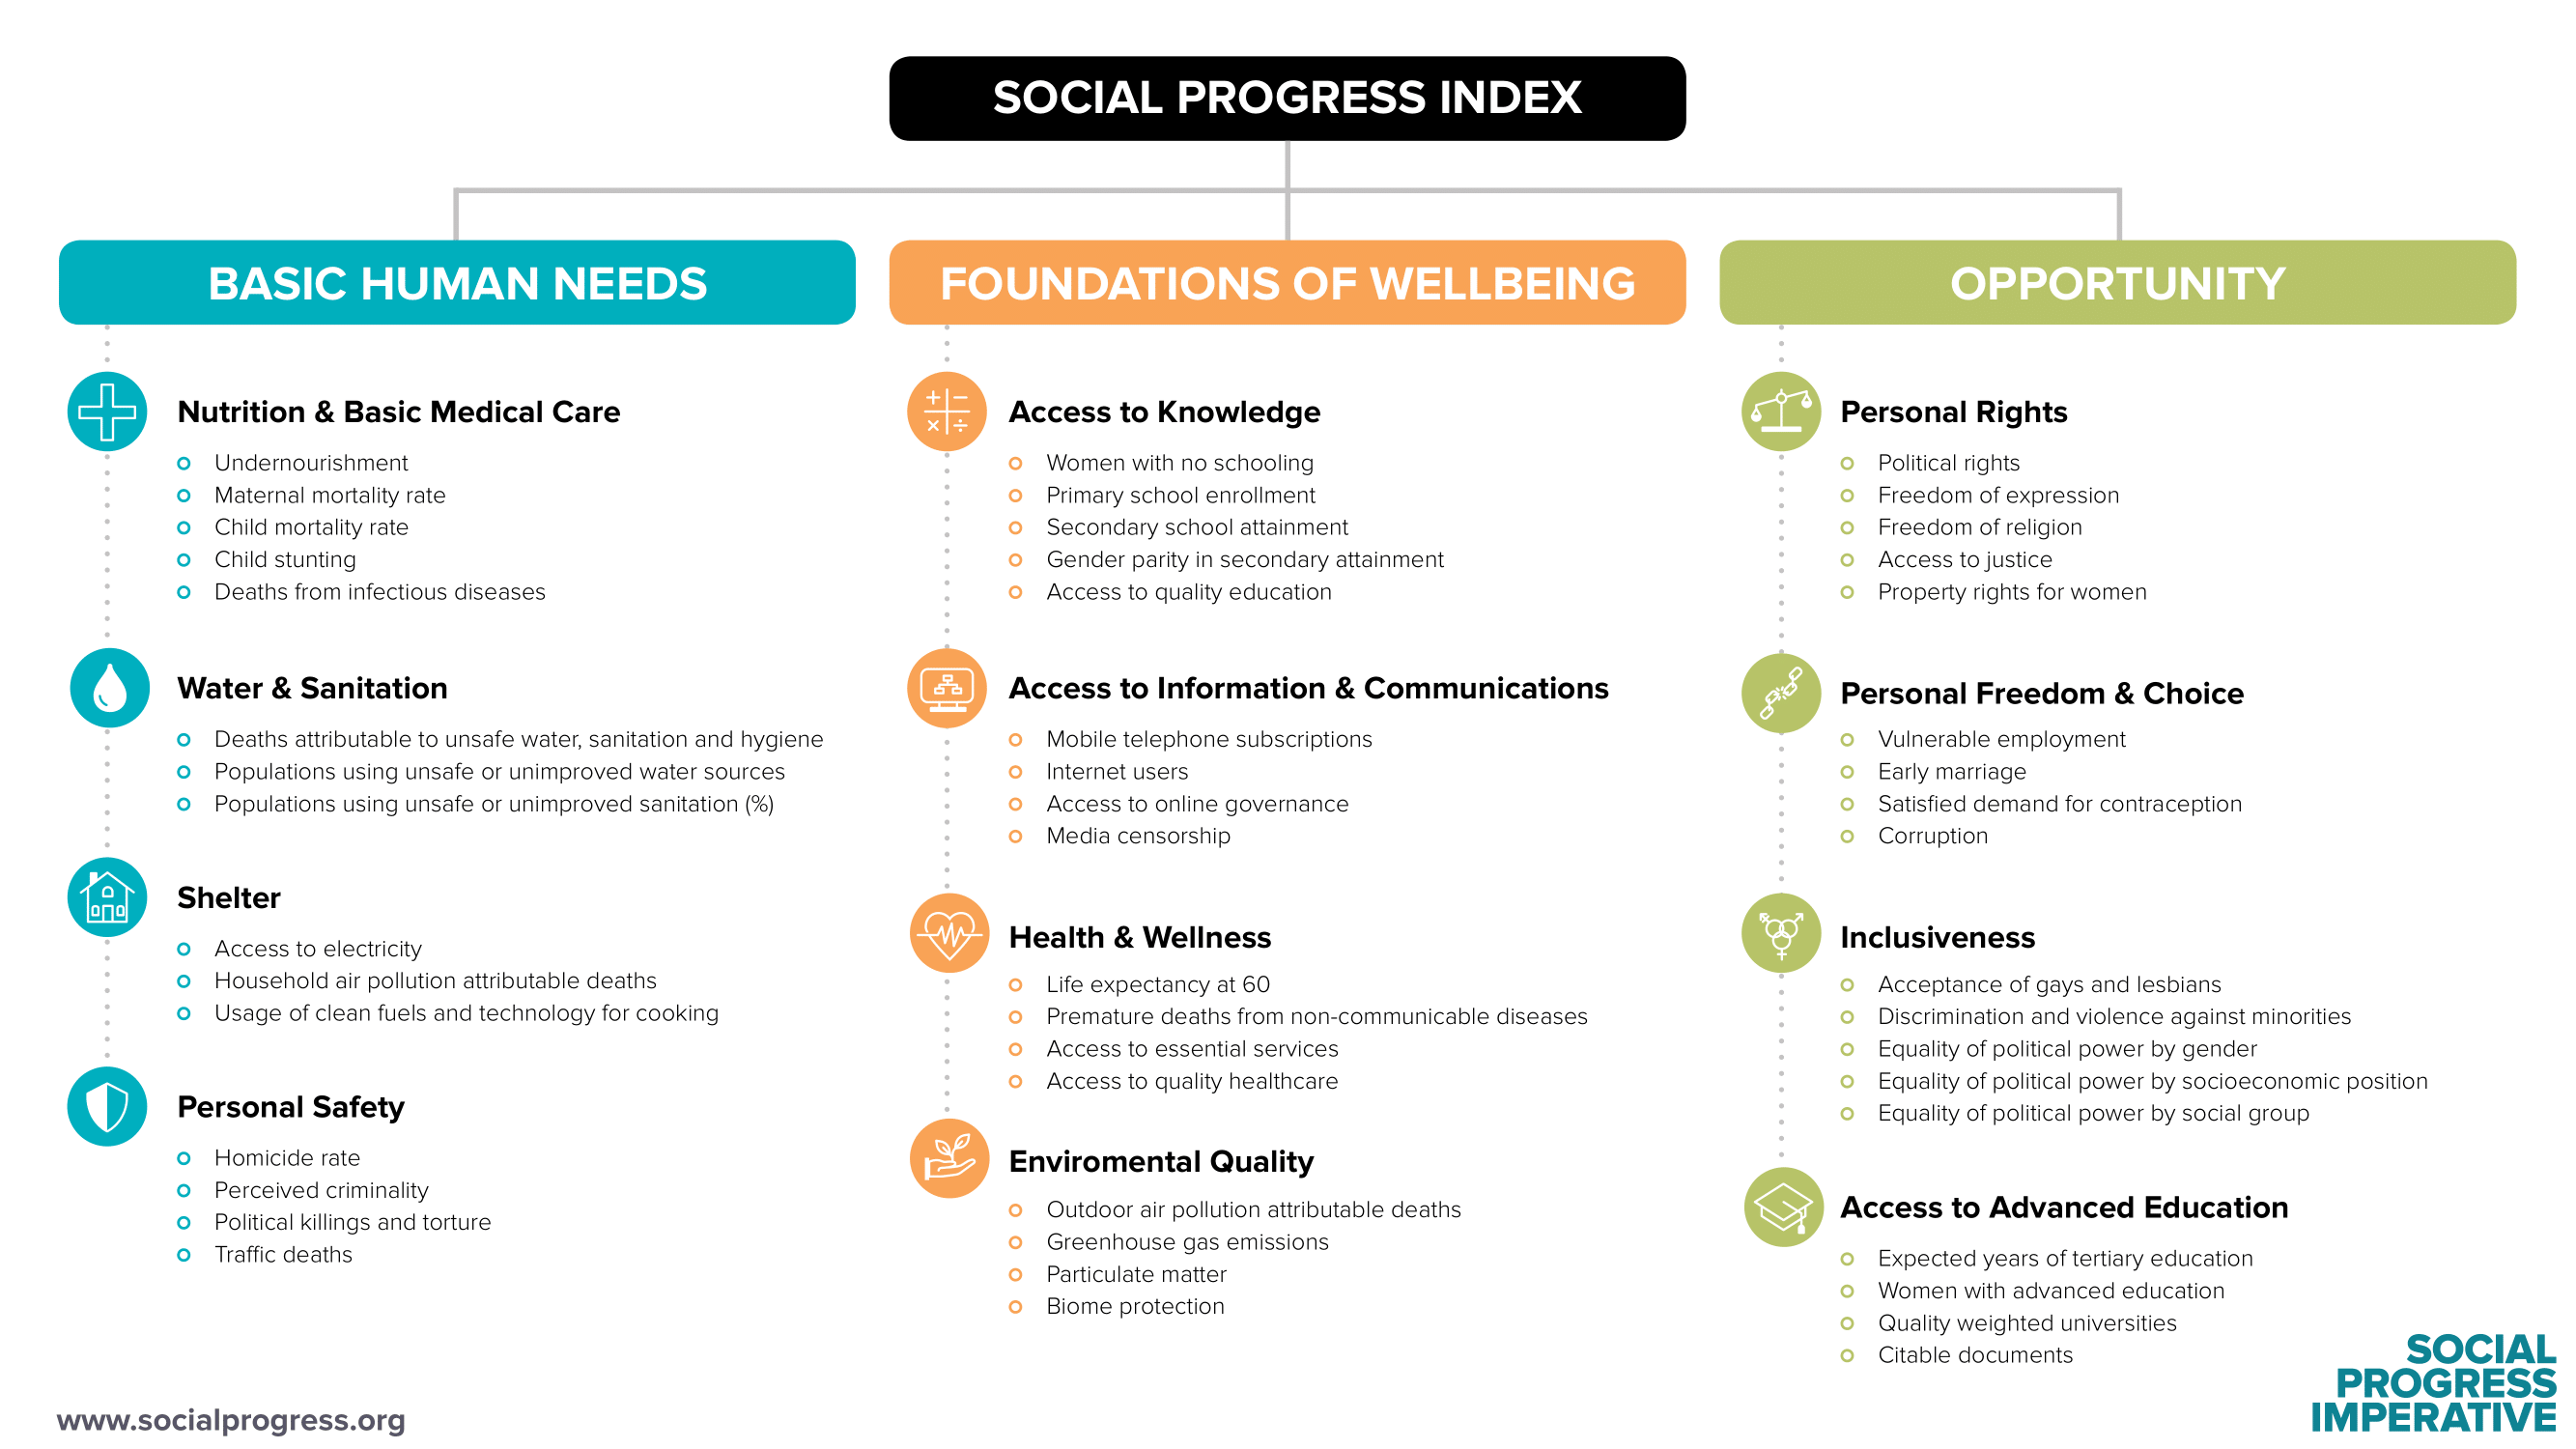
For this project, I decided to predict a country's Social Progress Index (SPI). SPI is a metric developed by Social Progress Imperative to deal with the shortcomings of GDP.
The Social Progress Index is a new way to define the success of our societies. It is a comprehensive measure of real quality of life, independent of economic indicators. The Social Progress Index is designed to complement, rather than replace, economic measures such as GDP.
SPI has 4 foundational key points that makes it different from GDP.
-
It is actionable and is able to be applied to both small communities and globally.
-
It looks at a broad spectrum of concerns ranging from basic needs to personal freedom and choice
-
It is inclusive of social and environmental factors and makes sustainability a priority.
-
It focuses on outcomes, not inputs and is independent of economic development. (ie. it does not factor in how much money a country has or how much it spends on healthcare)
Data
The features I wanted to look at for my model are 5 macroeconomic indicators, 4 different kinds of government expenditures, and 3 different energy sources based on the percentage it makes up out of total energy production in a country. The data was gathered from 5 different sources which include the: World Health Organization (WHO), World Bank Open Data, UNESCO Institute for Statistics Data Center, the Social Progress Imperative Database, and scraped data from the CIA World Factbook.
I only looked at data from the years of 2014-2018 for my training set because the earliest recording of SPI is in 2014. I used the most recent (2019) data as my test set.
Correlation Between GDP per capita and SPI
Although, economic factors don’t go directly into SPI, there is a strong correlation between GDP and SPI. However, a large GDP does not guarantee a high SPI.
 In fact, Costa Rica, the US, and Singapore have similar SPIs but have a wide range of GDPs.
After doing some exploratory data analysis, I found the top 5 countries with the highest increase and the highest decrease in SPI from 2014-2019. The top 5 increasing SPI countries are Ethiopia, Burkina Faso, Sri Lanka, Angola, and Luxembourg.
| Top Increasing Countries | SPI 14'-19' Difference |
|---|---|
| Ethiopia | 6.10 |
| Burkina Faso | 4.88 |
| Sri Lanka | 4.51 |
| Angola | 4.07 |
| Luxembourg | 4.04 |
The top 5 DECREASING SPI countries are Nicaragua, the United States(!), Brazil, Hungary, and Columbia.
| Top Decreasing Countries | SPI 14'-19' Difference |
|---|---|
| Nicaragua | -2.73 |
| United States | -1.12 |
| Brazil | -0.72 |
| Hungary | -0.32 |
| Columbia | -0.25 |
What was surprising was that despite the US' steadily increasing GDP per capita over the 2013-2018 time period, the United States hold 2nd place for countries with the strongest decrease in SPI! This further establishes the claim that an increase in GDP does not necessarily mean an increase in social well being.

Features
The features I selected to incorporate into my model were hand selected. It includes 5 macroeconomic indicators, 4 different kinds of government expenditures, and 3 different energy sources based on the percentage it makes up out of total energy production in a country.
5 Macro indicators
- GDP per Capita (PPP)
- Budget Surplus/Deficit (%GDP)
- Gross Savings (%GDP)
- Inflation Rate on Consumer Prices
- Tax Revenue (%GDP)
4 Gov't Expenditures (%GDP)
- Health
- Education
- Military
- Science, Tech, Innovation R&D
3 Energy Sources (%)
- Fossil Fuels
- Hydroelectric Plants
- Other Renewable Sources
Regression Methods
I experimented with using different regression methods for this project. The different methods I used were:
- Simple Linear Model
- Ridge
- Lasso
- 2nd Degree Polynomial Model
Without performing any transformations on my data, performing a simple linear model, Ridge, or Lasso regression would produce an R2 score of about 0.67. However, a 2nd degree polynomial would either produce a sub-0.4 R2 score or an R2 > 0.96. This tells me that the initial random state of the train validation split plays a big role in the polynomial model in addition to it tending to overfit at times. After doing cross validation, it performs comparable in the range of the other models.
I noticed that GDP per capita and Science, Tech, and Innovation R&D expenditure are highly correlated with SPI. This prompted me to perform a logarithmic transformation on these features.


After doing the log transformations and rerunning the models, all 3 models (simple linear, ridge, and lasso) performs well with R2 > 0.92 In the end, I decided to move forward with the simple linear regression model for the benefit of being able to easily interpret coefficients.
Using the hold out test dataset to evaluate the model, I was able to achieve:
R2 = 0.94
RMSE = 3.45
MAE = 2.69
| Feature | Coefficient |
|---|---|
| GDP per Capita (PPP) | 0.107 |
| Budget Surplus/Deficit (%GDP) | 0.0053 |
| Gross Savings (%GDP) | -0.29 |
| Inflation Rate on Consumer Prices | -0.095 |
| Tax Revenue (%GDP) | 0.019 |
The fitted model holds an R-squared of 0.94, along with an RMSE of 3.45, and MAE of 2.69. One of the strongest feature is GDP per capita, with a coefficient of 0.107. Meaning that for every 1% GDP increase, the model suggests a 0.1 point increase in SPI. An initially somewhat surprising find is that gross savings is moderately negatively correlated with SPI.
| Expenditure (%GDP) | Coefficient |
|---|---|
| Health | 0.024 |
| Education | 0.32 |
| Military | -0.41 |
| Science, Tech, Innovation R&D | 0.0212 |
Education has a great amount of influence on SPI, as well as does R&D expenditure. R&D expenditure coefficient tells us that for every percent of a percent of GDP increase, SPI increases by 0.02 points. We also see that expenses on military is highly negatively correlated with SPI.
| Energy (%) | Coefficient |
|---|---|
| Fossil Fuels | 0.012 |
| Hydroelectric Plants | 0.022 |
| Other Renewable Energy Sources | 0.054 |
Finally, looking at the energy terms we see that the one that influences SPI the most is renewable energy, but it should also be noted that fossil fuels usage is also slightly positively correlated with SPI.
These results confirm the claim made by the creator of SPI that countries should take increases in GDP and direct it into education and tech & innovation to maximize social progress.
Conclusion
Overall, building a model to predict SPI was successful. The recommendations to get from this model is that for countries with smaller GDPs the initial aim should be to increase GDP to best improve SPI. Meanwhile, for countries like the United States that already have a high GDP, it would be the most beneficial to increase government funding and focus spending on education and science, tech, and innovation R&D.