Metis Project-01
For my first project at Metis, I worked with a group of other students. My group consisted of Allen Ni, Andrew Duncan Sweeney, Brian Tam, and myself. The project was framed as an assignment commissioned by a company named WomenTechWomenYes. They wanted to optimize the placement of their street teams to reach out to people that may be interested in attending their annual summer gala.
While we could've looked at data from years not affected by COVID-19, our team decided to focus on three weeks of data from June 2020 to make it a little more interesting. Our data was collected from the MTA Developers page.
Things we were targeting:
- Top 10 busiest stations of the month.
- Busiest days of the week.
- Busiest times of day.
One struggle that all of us had was how extremely messy the data was! There were many different considerations we took while cleaning our data. Some of the issues were:
- entry/exit counts were compiled cumulatively
- multiple unit codes with the same station name
- multiple stations with more than one unit
- spontaneous jumps in counts when the counter would restart
- missing data for some time blocks
- audit recovery stamps
- duplicated rows
Working with MTA data definitely gave us a real feeling of how messy real data is! Not only did we have to find solutions to these problems, I was also extremely hard to find them! It comes to show just how important it is to really spend time understanding the data that we're working with.
While looking through June 2020 data, we thought it would also be interesting to compare the this year's traffic with last years. Below, we show a comparison of the top 10 stations in June 2019 and June 2020.
| Pre-COVID | During COVID |
|---|---|
| 47-50 St - Rockefeller Center | 125th St |
| 42 St - Port Authority | 14 St - Union Square |
| 14 St - Union Square | Jackson Heights - Roosevelt |
| Grand Central - 42 St | Brooklyn Bridge |
| Times Square - 42 St | Flushing - Main St |
| 34 St - Penn Station | 42 St - Port Authority |
| 42 St - Bryant Park | Junction Blvd |
| 34 St - Herald Square | 59th St Columbus Circle |
| Fulton St | Sutphin Blvd - Archer Ave -JFK |
| 7 Avenue | Jamaica Center |
It turns out that there are only 2 stations in common between the Pre-COVID and during COVID: 42 St - Port Authority and 14 St - Union Square. We also found that ridership decreased by 90% this year as compared to historical traffic.
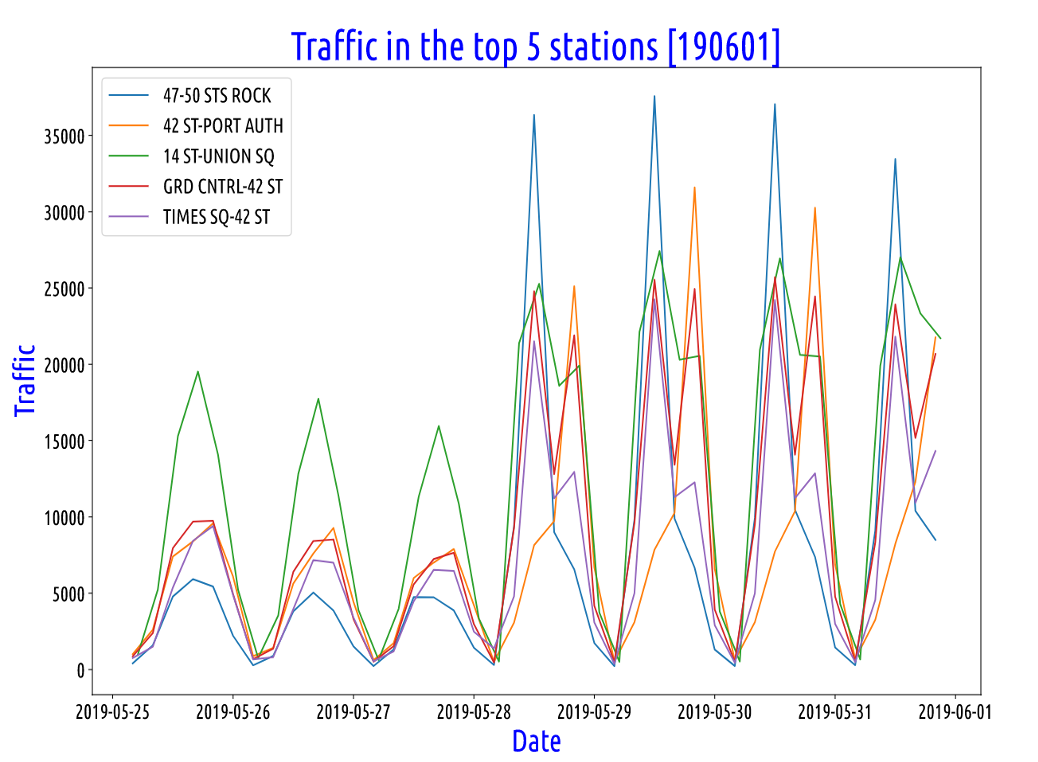
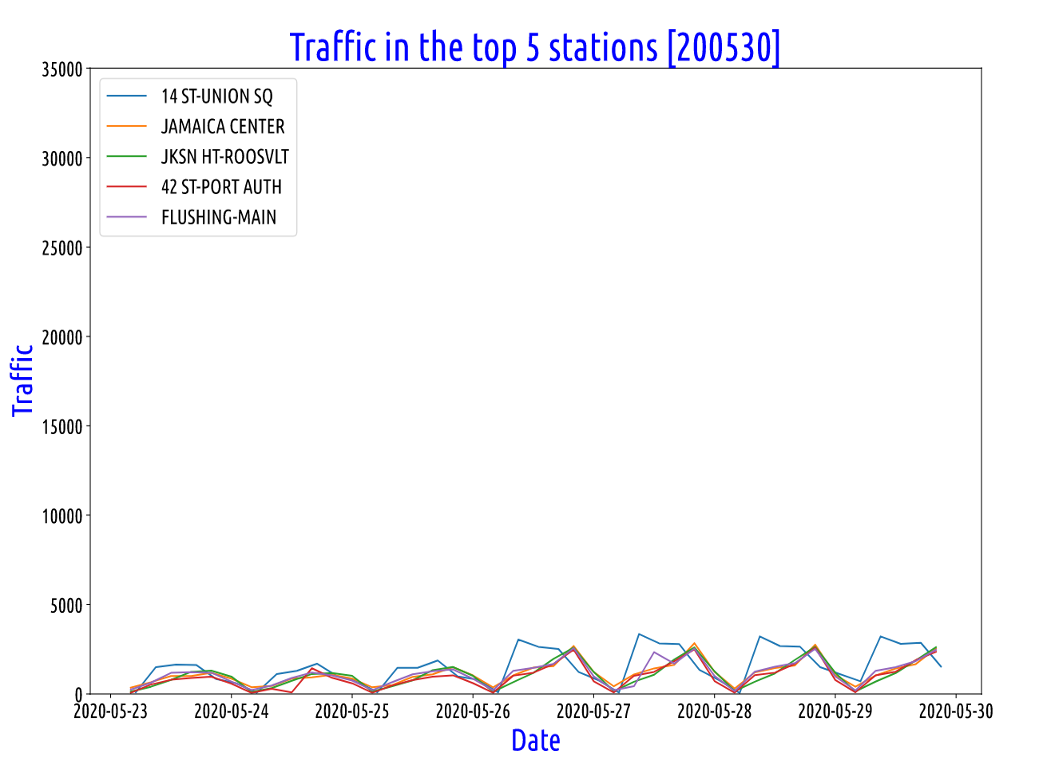
Above, we get a sense of just how drastic the drop is. Below, we have a graph of just one week of June in 2020, scaled appropriately to show the detail between the 5 busiest stations. We see that weekdays are far busier than weekends. We also see that Union Square is consistently the busiest station during the morning rush throughout the week. Other stations experience peak traffic during the evening. We conclude that WomenTechWomenYes should focus their outreach efforts on weekdays as opposed to weekends. Additionally, they should spend most of the morning around Union Station, while in the evening they could split up into smaller groups located at the other stations.
We also played around with Folium as we wanted to visualize where these stations were located in relation to each other. Another detail we thought might be useful to out client was the COVID infection rates in different areas of NYC to visualize some risky locations that our client may need to take into consideration.
Pre-COVID Stations
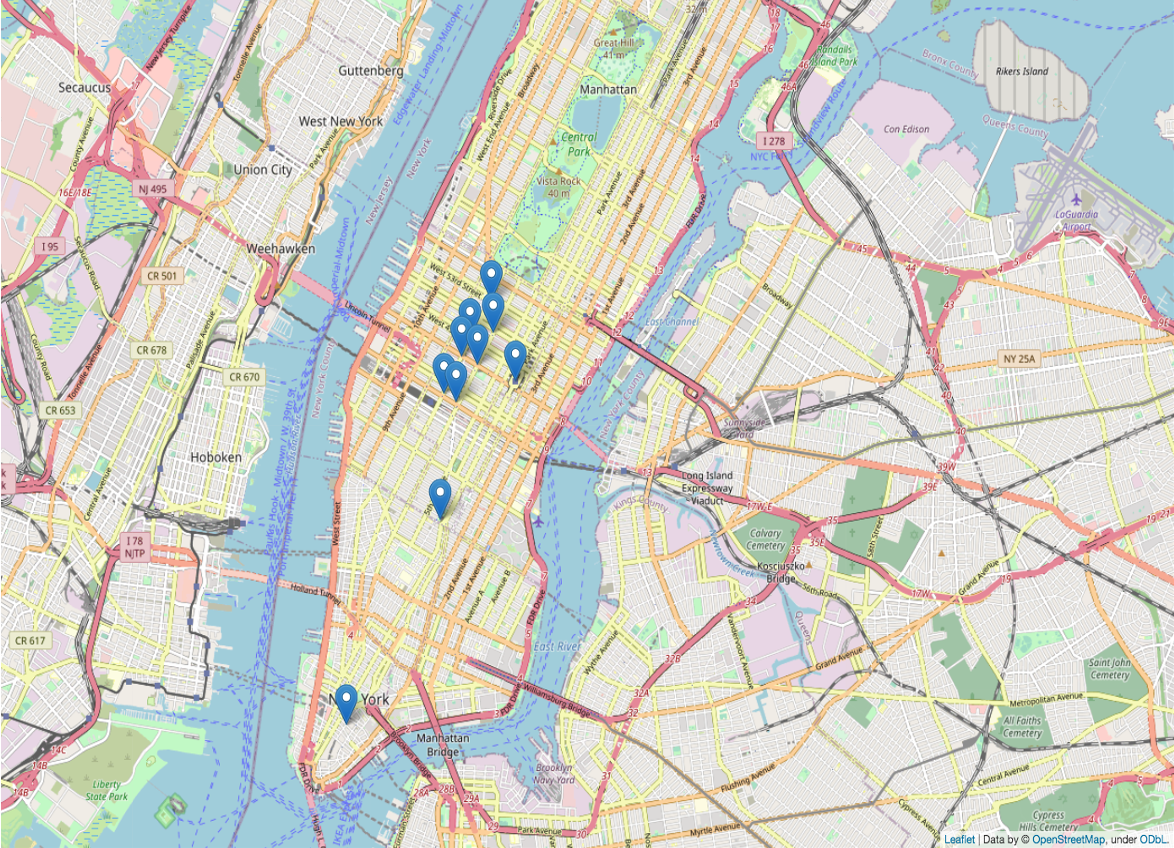
Prior to COVID, all top stations are located in Manhattan. This makes it easier for our canvassers to move around to different stations throughout the day. Our teams could start working in the early morning rush, take a break in central park, then commute to other stations for the evening rush.
JUNE 2020 Stations with COVID case counts
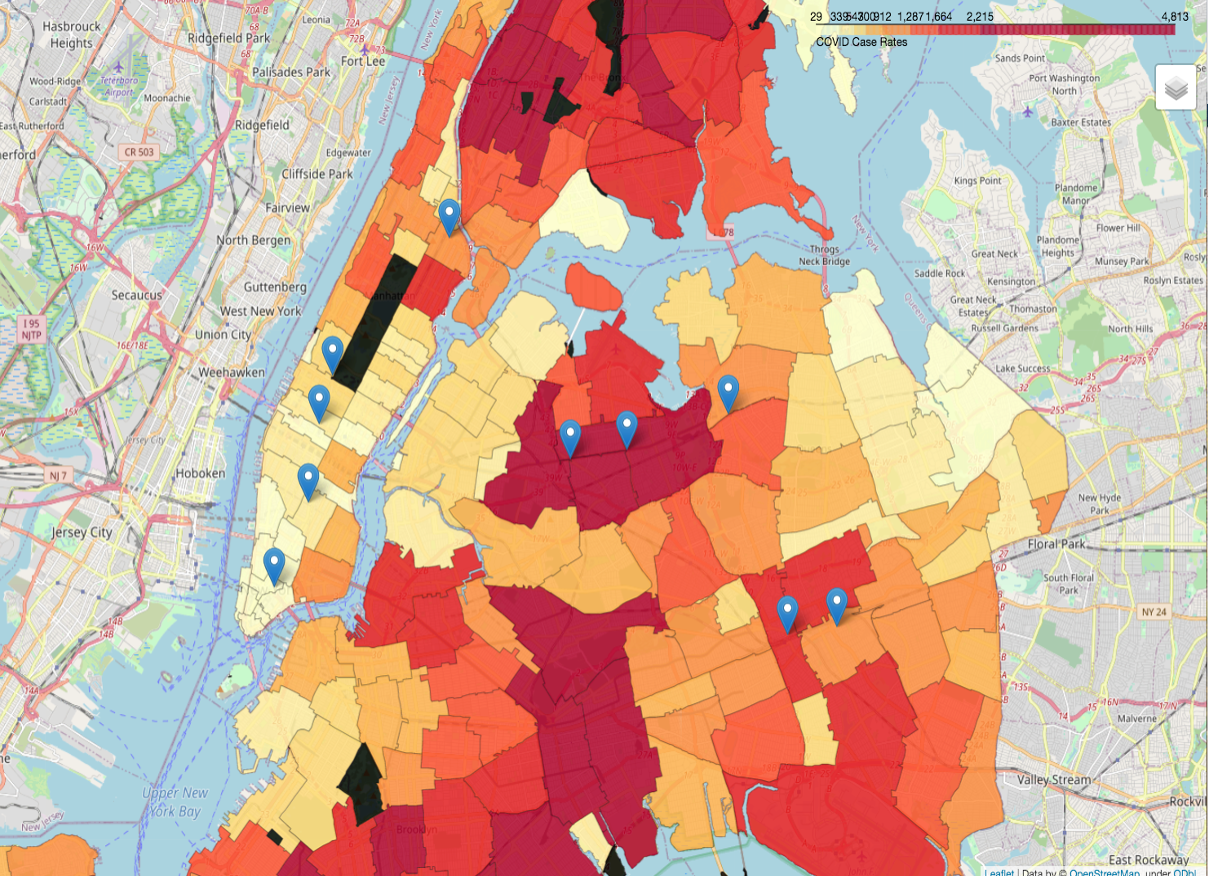
While mapping out our June 2020 top stations, we notice that traffic patterns are more spread out across New York City. Hence, it would be best to have 2 main groups, one in Manhattan and another in Queens/Brooklyn and later distribute over specific stations.
Another point of interest for us was that the June 2020 map shows primarily where people live and where essential businesses are located and traffic counts are not inflated with tourists. If we were to be doing this analysis on last year's data, we would have run into the problem where a lot of the traffic captured would be from tourists visiting the city. Here, we have captured where locals frequently travel on a day to day basis and would provide a better audience for our outreach program.
Aside from this, my group mate, Allen Ni, mentioned a very interesting observation on how this study gives us an unintended insight into NYC's social infrastructure. From this, we have captured the most essential train stations for New Yorkers and I think that's pretty cool!